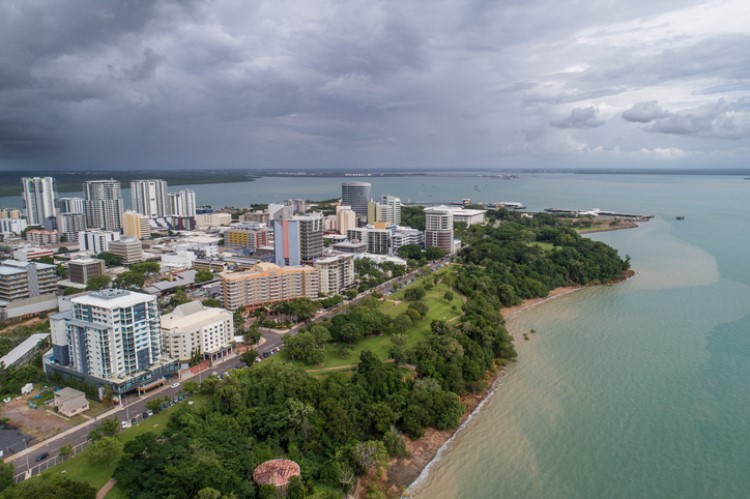
The latest market analysis by CoreLogic showed that the housing downturn is unevenly felt across Australia, with Darwin reporting the most significant decline from the market peak amongst state capitals.
According to CoreLogic, house prices in Darwin fell by 27.5% in March 2019 from the market peak in October 2017 — this decline meant that homes in Darwin lost around $145,980 in value.
In terms of rate of decline, Perth recorded the second biggest slump at 18.1%. Homes in the Western Australia capital shed around $97,797 in value.
However, looking at the total dollar decline, Sydney reported the second worst fall — homes in the city now cost 13.9% less than in the market peak, losing $124,739 in value.
"While a values percentage fall indicates how the market is fairing, seeing the actual value of the declines is a stark reminder of the actual losses," CoreLogic research analyst Cameron Kusher said.
Overall, national home prices declined by 7.4% from the market peak, equivalent to a loss of $40,590. Across regional areas, Western Australia saw the biggest price drop at 31.6%, with homes recording an average loss of $118,734. Meanwhile, only values in regional Tasmania and Hobart remained at the highest level on record.
Kusher said that while this is not a good time for property investors to sell, the downturn presents an opportunity for potential homebuyers to snap up a dwelling for lower prices.
"With advertised stock levels remaining high and mortgage rates tracking around the lowest level since the 1960s (and potentially moving even lower later this year), active buyers are back in the driver’s seat to take advantage of improved housing affordability and the low cost of debt," he said.
The table below shows the change in dwelling values across regional areas and state capitals:
Dwelling value declines from market peak to March 2019 |
||
|
|
In rate terms |
In dollar terms |
|
National |
7.4% |
$40,590 |
|
Combined regionals |
2.5% |
$9,464 |
|
Combined capitals |
9.2% |
$59,478 |
|
|
|
|
|
Regional NT |
7.9% |
$31,761 |
|
Regional Tasmania |
n/a |
n/a |
|
Regional WA |
31.6% |
$118,734 |
|
Regional SA |
3.4% |
$8,623 |
|
Regional Queensland |
4.9% |
$18,773 |
|
Regional Victoria |
0.8% |
$2,749 |
|
Regional NSW |
4.1% |
$18,674 |
|
|
|
|
|
Canberra |
0.2% |
$1,071 |
|
Darwin |
27.5% |
$145,980 |
|
Hobart |
n/a |
n/a |
|
Perth |
18.1% |
$97,797 |
|
Adelaide |
0.5% |
$2,307 |
|
Brisbane |
1.6% |
$7,796 |
|
Melbourne |
10.3% |
$71,404 |
|
Sydney |
13.9% |
$124,739 |
Collections: Mortgage News


Share